5 Website Performance Tools You Should Know About

Website performance is critically important to your sites success.
Did you know that:
- 47% of customers expect a webpage to load in 2 seconds or less (skilled.co).
- Bounce rates nearly double as a page load times rises from 2 seconds to 4 seconds (section.io).
- Google favors fast sites over slow ones (searchengineland.com).
If you want more traffic, higher sales, and improved search engine rankings, your website must be fast.
To make your site fast, you have to know where it is slow. Below, I highlight 5 website performance tools to help you identify web bottlenecks. From novice to expert, these web performance tools help you understand what parts of your site are slow.
We use a combination of these tools in our web performance optimization work. By using these tools, content delivery networks, and server optimizations, you too can enjoy a fast web site.
Here’s some pros & cons of five website performance tools we use on a regular basis.
1. WebPageTest
WebPageTest is one of the oldest and most robust free web performance testing tools. Google even contributes part of the code. WPT is for those needing to dig deep into performance optimization.
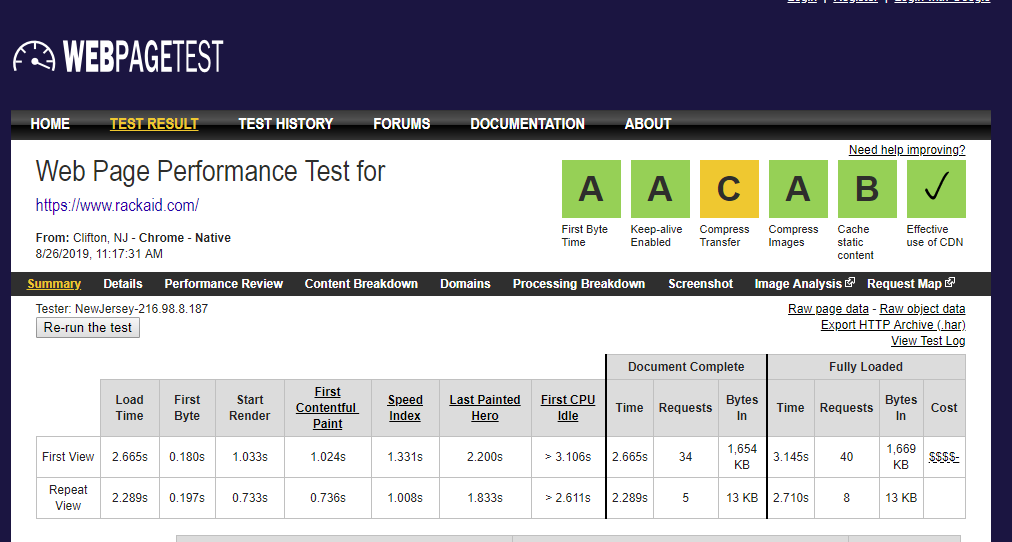
The waterfall charts are handy in identifying slow-loading assets. There are also many advanced features you can use to debug Javascript issues, simulate single points of failure, and more.
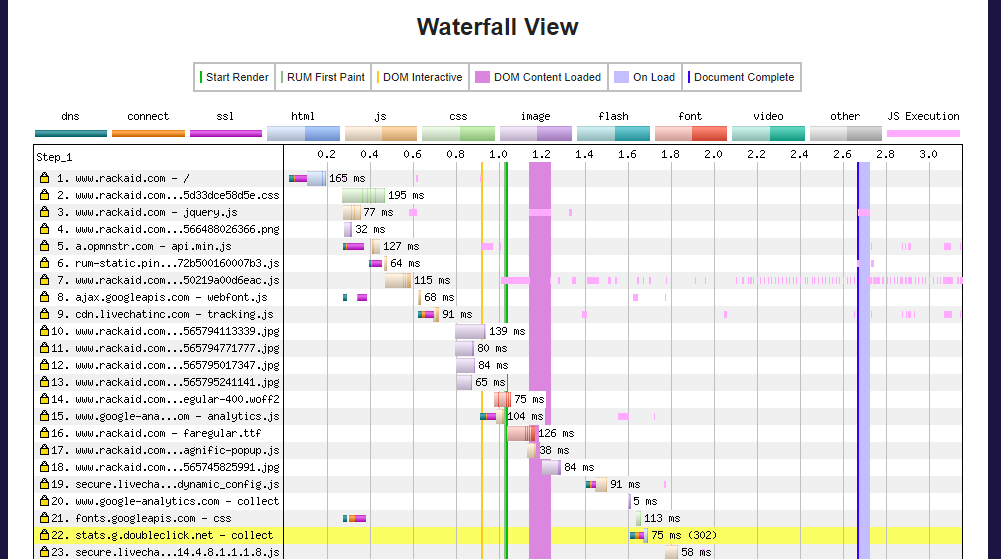
Lastly, you can even download the tools and run them within your network. Great for testing assets you don’t want to expose to the internet.
Pros:
- In-depth, detailed metrics on nearly every aspect of the performance of your site.
- Choose from multiple browsers, location, and connection speeds.
- It does both un-cached and cached views.
- Run multiple tests at once.
- Can do authenticated scans
Cons:
- There is a steep learning curve to get the most from the results.
- Popular locations and servers may have a queue.
- Somewhat outdated interface.
Tip:
When you start your scan, set the number of tests to 5. When you get the results, use the 3rd result for your analysis. The system automatically sorts runs from slow to fast, so the 3rd run is in the middle of the range.
2. GTMetrix
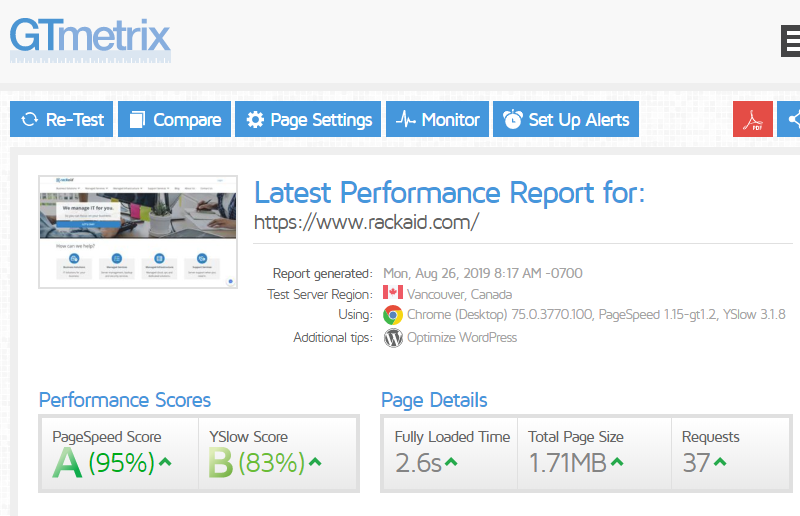
Of the more advanced tools, GTMetrix is well organized and easy to use. They also try to explain the various numbers, a handy feature if you are new to web performance optimization.
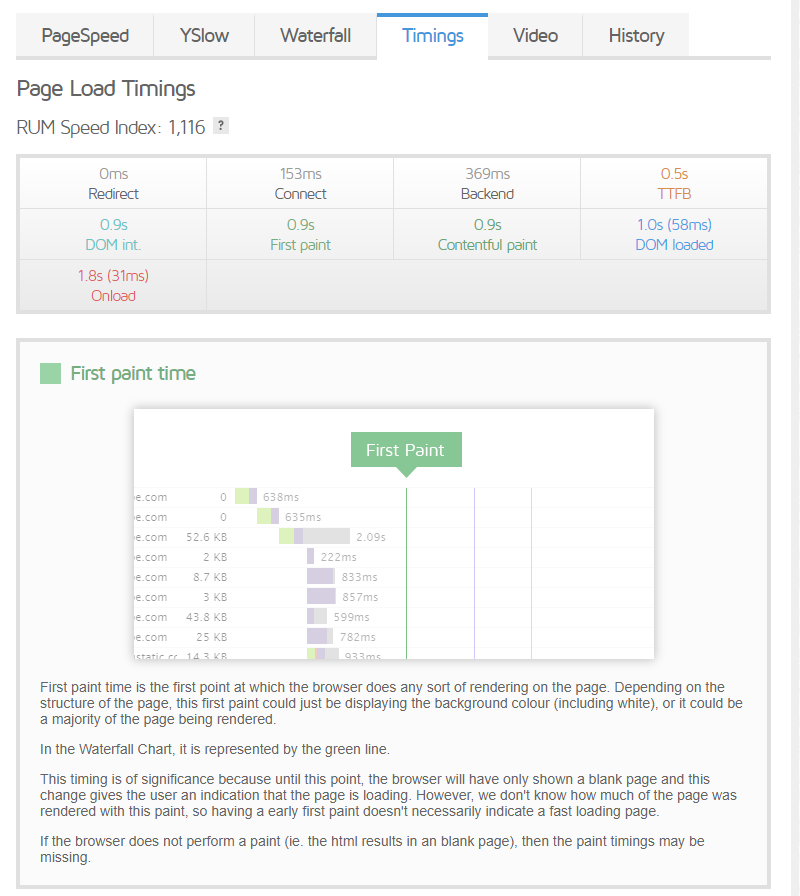
For example, under the timings tab, GTMetrix shows a description of the data point as you hover over it. A great feature if you are new to web performance optimization – which is full of jargon.
The free URL monitoring is a plus. I recommend you always check any instant tests against your historical averages. By having some history, you may be able to rule out some temporary network problems as a reason for a sudden performance drop.
Pros:
- In-depth, detailed metrics on nearly every aspect of the performance of your site.
- Easy to use interface.
- Free monitoring for one domain.
- Educational details built into the interface.
- It can do authenticated scans.
Cons:
- Usage requires registration for more in-depth features.
- Using the free plan, you have limited test locations and options.
- Sometimes get very inconsistent results with consecutive scans.
Tip:
If you do a lot of optimization work, consider their paid plans. You gain access to more locations, bandwidth adjustments, and browsers. Most importantly, the historical data allows you to spot when problems arise.
3. Varvy
Meet the lighter side of web performance optimization. Varvy makes general but essential recommendations for your site’s performance. If you have never optimized your site or new to optimization, I recommend you start here.
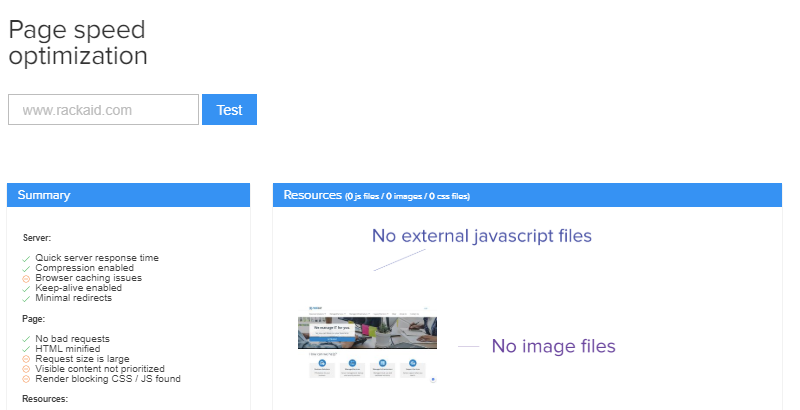
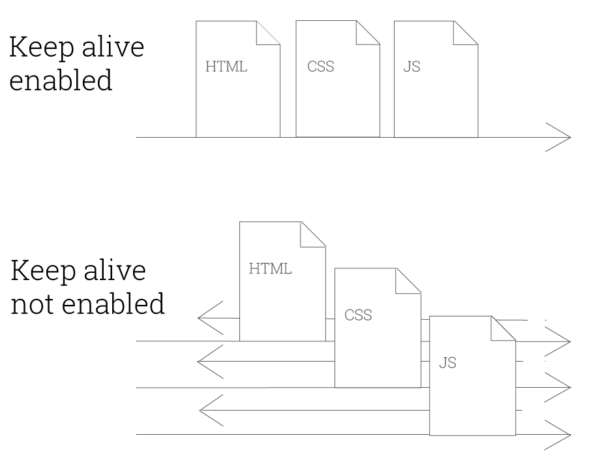
Varvy does a great job of explaining how recommended changes impact web performance. For example, “Keep-Alive” may not mean much to you, but Varvy provides a clear explanation for this rule and how to implement it.
Great tool for beginners.
Pros:
- Clean, modern interface
- Easy to understand reports. It provides excellent educational links within the reports.
Cons:
- Only basic performance metrics.
- No customized testing.
Tip:
Varvy’s explanations are clear even for a web optimization novice, so I often send this to customers who’ve done little to optimize their sites.
4. Pingdom
I list this as I also use their monitoring services. Pingdom gives you a glimpse of what you can get in their paid monitoring services.
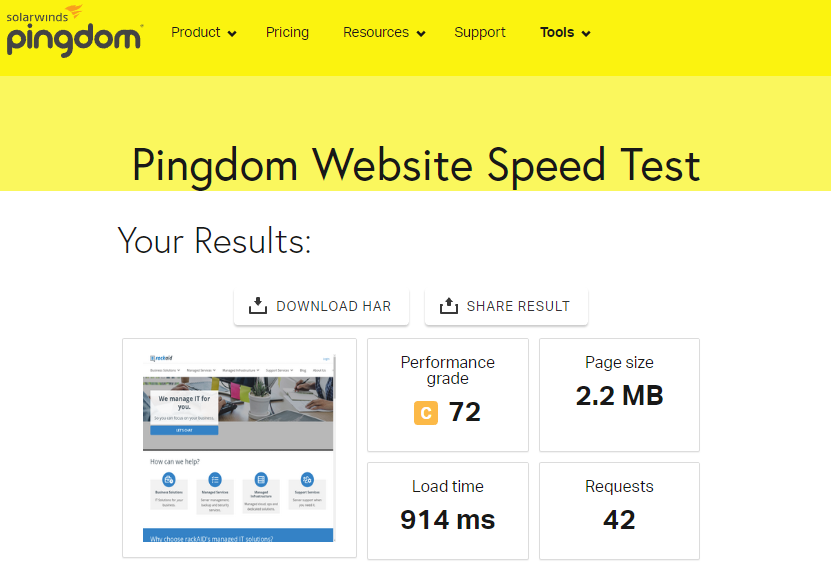
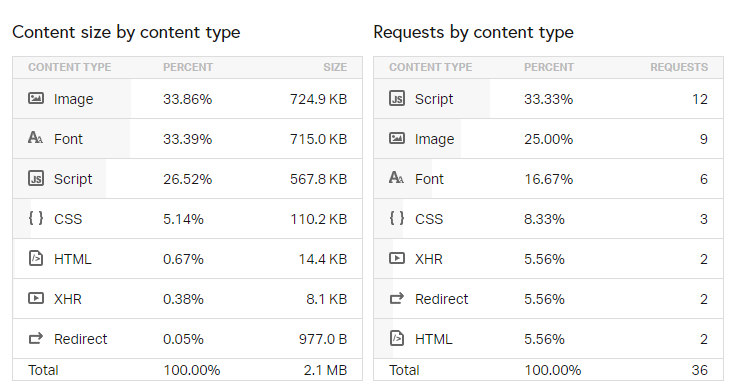
Their tool includes fewer details than GTMetrix or WebPageTest but is usually very fast. The waterfall charts are easy to use and the output easy to understand. A nice feature is the summary tables for various metrics:
I often refer less technical customers to this tool.
Pros:
- Clean, simple interface with well-organized summary stats.
- In-depth waterfall charts.
- Easy to understand results.
Cons:
- The free version lacks in-depth tools found on other sites.
- There are limited locations and browser choices.
- Performance grade can be misleading.
Tip:
Pingdom’s paid tools include RUM – real user monitoring. If you are serious about optimizing your web performance, you have to use RUM.
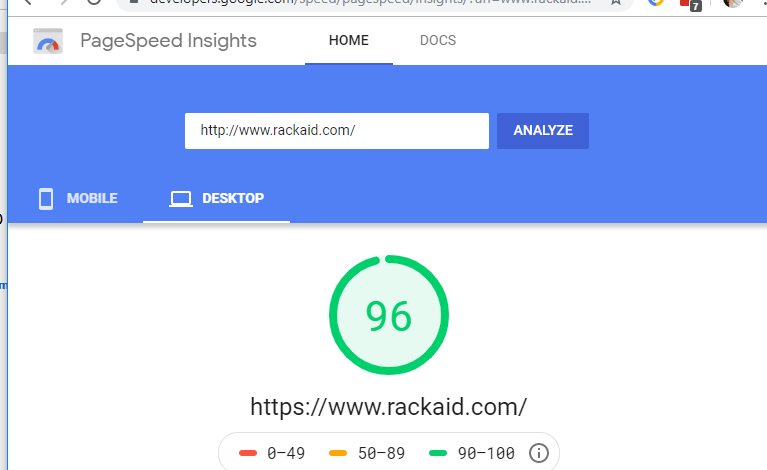
5. Google Pagespeed Insights
Google’s Pagespeed Insights is probably the most popular but possibly the most misunderstood tool on the list. People obsess over the scores, but they may not reflect the true speed of your site.
Pagespeed often makes recommendations that you can’t fix — like adding caching headers to Google’s javascript tracking code. This can be frustrating.
Results vary considerably between runs. I’ve seen as much as 300% variation between runs within a few minutes, making it challenging to optimize your site. However, given that Google considers website speed as a ranking factor, I recommend you always check your website’s performance is this tool.
Pros:
- Google-specific recommendations may help with search results.
- Offers both mobile and desktop testing
- Clean, easy to use interface.
Cons:
- No ability to pick the location.
- Results can vary considerably between runs.
- Opportunities are often not actionable.
Tip:
You don’t even need a web-based application to do testing. Chrome has Lighthouse built-in. Lighthouse is an automated tool for testing your site performance. Think of it as a beefed-up version of Page Speed insights.
Summary
No matter which website performance tool you pick, you need to make sure your site is fast. WebPageTest.org and GTmetrix are my go-to free tools. For paid options, I highly recommend Pingdom’s tools. They can provide more insight into issues, especially if you have peak traffic periods where you cannot test or monitor in real-time. Real User Monitoring is essential if you want to see what your users see.
By, the way, did you know we offer server support for website performance issues? If you see a long Time to First Byte time, then your server is returning replies slowly. By changing PHP run-modes, tuning or upgrading MySQL and Apache, we have improved customer’s load times by as much at 500%.

Jeff Huckaby · Founder, RackAID
How I use AI in my writing and editing process
Written during RackAID's managed services era. The tools have changed. The thinking still holds.